


Preliminary analysis of the 2025 Election Results

It is currently the morning of Thursday the 7th of May. The 2025 Australian Federal Election was less than a week ago and counting is still taking place. But, already patterns are emerging of how different demographic groups shaped the election outcome, and what this might mean for the attitudes of the Australian population and the prospects for the political parties over the next few years. The complete picture will only really be available once high-quality, individual survey data is available. However, we can get some insights from the aggregate data at the electorate-level.
This is what we know in aggregate, based on data summarised the ABC. Early on Thursday morning, 80.6% of the vote has been counted, with the ABC listing 11 seats in doubt, 89 seats for the ALP, 40 for the Liberal/National Coalition, 0 for the Greens, and 10 for other parties. The estimate is a 54.9 to 45.1 per cent two party-preferred estimate for Labor relative to the Coalition, or a 2.7 per cent swing towards Labor.
The ABC has also released a (really interesting) analysis comparing ‘the demographics of each electorate with how those electorates voted.’ Colleagues of mine – Dr Jill Sheppard and Dr Intifar Chowdhury – have given some interesting insights in response, and I think some of the patterns are quite stark. In my view though, I think the ABS data analysis misses a couple of determinants, that also align with our survey data, released just prior to the election. I summarise some additional analysis below.
The data
The primary source of data I am using comes from the Australian Electoral Commission (AEC) and was current as of 5:52pm, on Wednesday the 7th of May. I focus for now on the First preferences by candidate as the two-party preferred data is only available for 120 Electorates, with some of these seats giving implausible results. Instead, the data I use has information for all 150 Electoral Divisions, with an average total number of votes per Electorate (including informal votes) of 97,309. I have four outcome variables of interest, measured for Electoral Divisions:
Coalition primary vote;
Labor primary vote;
Green primary vote; and
Independent primary vote;
To explain these outcome variables, I use data from the 2021 Census of Population and Housing, available through their Tablebuilder platform. Specifically, I first calculate the average age of those who lived in the Electorate in 2021 (using current boundaries). The remaining variables are percentages of the population with the following characteristics:
Female;
Aboriginal and/or Torres Strait Islander;
Born overseas;
Has completed Year 12;
Lives in a household with the median equivalised income, or less;
Works for the public sector (amongst those employed);
Is renting.
I standardise these percentages so they all have a mean of zero and a standard deviation of one (a z-score). This helps us compare the results when different types of variables are used, and reduces a little bit the issue of multi-collinearity.
The analysis used in the ABC article referenced above is bivariate. That means that they compare two variables with each other. There is nothing wrong with using such an approach, but it makes it harder to isolate the direct associations. For example, they look at the relationship with proportion renters and Coalition primary vote, as well as average age and primary vote. That’s really interesting but of course age is also related to renting. So, what is having the stronger association – age or renting? Alternatively, is there an additional variable that explains voting patterns even more strongly.
One way to look at this is via regression analysis. This technique allows us to look at the factors associated with our outcome variables, whilst holding other variables in our model constant. Doing so gives us similar findings to the ABC, but with some nuances and sometimes slightly different conclusions.
Factors associated with primary vote
Let’s start by looking at the factors associated with the primary vote for the four parties or groupings of parties. The follow demographic patterns emerge:
Coalition vote is higher for areas with: a lower Year 12 completion, low income share, public sector workforce, but a higher average age.
Labor vote is higher for areas with: a higher per cent born overseas.
Greens vote is higher for areas with: a lower average age, per cent born overseas, public sector workforce, but a higher Year 12 completion, low income share, and rental rate.
Independent vote is not associated with any of the demographic variables in our regression analysis
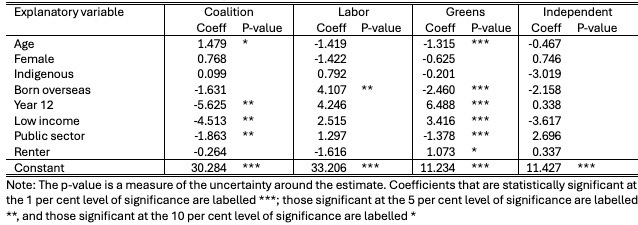
There are a few key points to note from the analysis. First, there is no relationship with gender at the regional level and first preference vote. That doesn’t mean that gender doesn’t matter – individual-level data suggests it does. Rather there are very few electorates with large gender differences, so any individual variation is likely to cancel out.
Age, on the other hand, does seem to be highly predictive. The coefficient for the Labor vote is not quite statistically significant (the p-value is 0.170), but on balance older electorates vote for the Coalition, younger ones for Labor and the Greens.
It appears that the public sector workforce was not very supportive of the Coalition, and here we include those who work for State/Territory and Local Governments, as well as the Federal Government. But, it is also not that supportive of the Greens.
High rental areas definitely favoured the Greens, as did low-income areas. Indeed, despite the discussion of the Coalition targeting working class, outer-metropolitan areas, those areas with a high proportion of the population in low-income houses still had a much lower Coalition primary vote.
The factor that was not picked up in the ABC analysis though, is education (Note: I find similar results if I use the percent with a degree rather than per cent that have completed Year 12).
Those areas with a higher per cent of the population that have completed Year 12 have a much lower Coalition primary vote, and a much higher Greens vote. Further, although the variable isn’t significant in the Labor analysis (p-value = 0.197), the coefficient is positive and quite large. And, of course, Greens preferences tend to flow to Labor. As we saw after the 2022 election with survey data, and are likely to see after we get the 2025 data, the Coalition has lost support amongst those with relatively high levels of education, and it is very hard to see it being competitive without finding a way to bring that support back.
Summary thoughts
In the days following the 2025 Australian federal election, early results suggest a clear but complex shift in voting patterns across electorates. While Labor appears to have benefited from a national swing, a closer analysis of primary vote data and demographic characteristics reveals a deeper story. Age, education, income, and housing tenure all played a significant role in shaping electoral outcomes—but not always in expected ways. Older electorates leaned toward the Coalition, while younger, lower-income, and higher-renting areas favoured the Greens. Notably, areas with higher levels of education showed significantly lower support for the Coalition, reinforcing a long-term trend that may have major implications for the party’s future.
While we await more detailed individual-level data, these early patterns highlight the importance of structural demographic change in Australian politics—and suggest the traditional political divides are continuing to realign.